What the DSA transparency database tells us so far

PRISM TECH POLICY NEWSLETTER
Friends of PRISM,
I’ve been writing a lot about content regulation in the last few editions. After all, there’s a high risk of policy change as 2024 elections unfold, from the US to India and beyond.
I wanted to look a bit more at platforms’ content moderation efforts to see what companies are already doing as policymakers look to tighten the rules. Luckily, the EU’s Digital Services Act (DSA) mandated transparency reporting for content moderation decisions, and now there are more than five months of data, giving us the chance to start to gain some insights from the associated transparency dashboard.
Unfortunately, the dashboard itself is a bit hard to parse for insights – it’s full of messy data and hard-to-use toggles. The good news is, I parsed it so you don’t have to.
Apologies upfront: We are nerding out here with a chart and data-heavy edition.
George
THE BIG TAKE
What the DSA transparency database tells us so far
Digital platform transparency is becoming real; even early looks at the data should worry platforms. They can now be scrutinized — not just by regulators but by everyone — and compared — not just relative to legal obligations but to their peers’ approaches. This is the start of the right type of “race to the top” in content moderation we need.
What is the DSA transparency database?
In September 2023, the DSA transparency database was launched.
Digital platforms remove or restrict content on their sites all the time. Regulators wanted more transparency about these decisions. So, the DSA required platforms to submit Statements of Reasons (SoRs) for removing and restricting content and explain why using various metrics.
The platforms covered include a range of marketplaces, app stores, social media sites, and more. But essentially it's the usual suspects (Meta and Alphabet’s platforms, TikTok, X, Snapchat, LinkedIn, Pinterest, Apple’s App Store, Amazon, and then some more unexpected ones - AliExpress, Booking.com, and Zalando).
The metrics collected include every instance of removing or restricting content, the type of content restricted, explanations of the actions (e.g. the platforms’ own rules or legal requirements), how decisions were made (e.g., automated vs not automated), and more.
What can we learn from it so far?
Looking at the database dashboard itself tells us very little of value, even as you toggle through the various views. So you need to do some digging.
Dashboard snapshot:
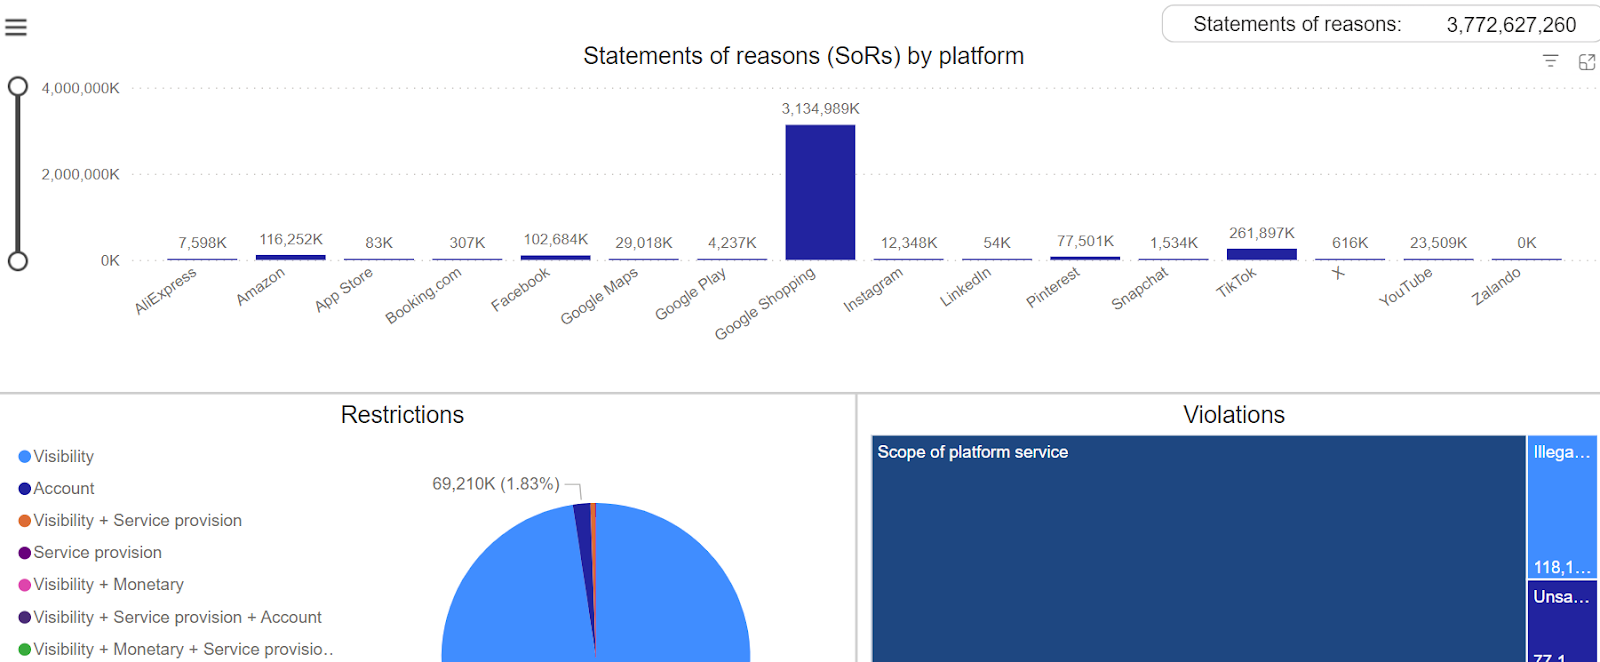
Much of the difficulty is because all of the numbers are skewed by Google Shopping, which submitted more than 10x the number of SoRs than the next largest submitter ( TikTok). This is likely for technical reasons, almost all are for “scope of platform service” reasons, which is likely in this case due to Google removing products that they don’t allow to be offered on their platform in large numbers (the vast majority are done with fully automated detection and decision-making processes).
It is also generally due to dashboard design, problems with how the platforms use different reporting metrics, and the overall mixing of different issues — from e-commerce IP and scams to social media child protection.
Frankly, the biggest regulatory issue is social media. So diving just into that, here are three insights we can already learn:
Video platforms moderate more aggressively - this has implications for video strategies of firms like X and Instagram;
Pinterest is making other platforms look bad; and
Different moderation approaches should worry the platforms.
1. Video platforms moderate more aggressively
TikTok and YouTube are the only platforms where there is a material likelihood of content being moderated.
To get to this, we need to do some “un-skewing” of the data. First, take out Google Shopping (for reasons mentioned above). After, here are the total SoRs by platform.
SoRs by platform (Sep-Feb):
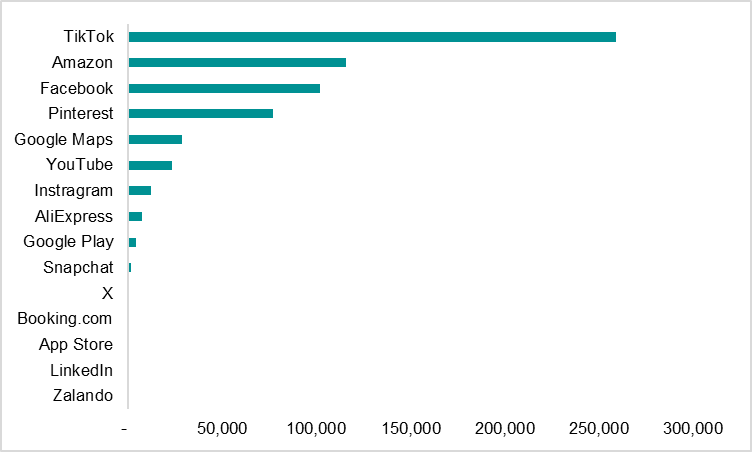
But, we need to un-skew even more. The above shows totals, which of course affects outcomes for a variety of reasons. This is in part due to different user bases in the EU, but actually primarily because of the different types of platforms they are.
YouTube has the highest number of EU users of the major social platforms (which are most interesting from a moderation standpoint).
However, the number of videos uploaded per day by YouTube is by far the smallest content throughput. Globally, Facebook and Snapchat each see almost 5 billion new posts each day. YouTube has only 3.7 million new videos per day.
Looking at the major social platforms (Pinterest excluded due to data availability) and making some broad assumptions for EU posts per day (total global posts per day divided by the proportion of EU users to global users), we see YouTube and TikTok are the only ones with a meaningful likelihood of a post being affected by an SoR.
SoRs per million posts (rough estimate):
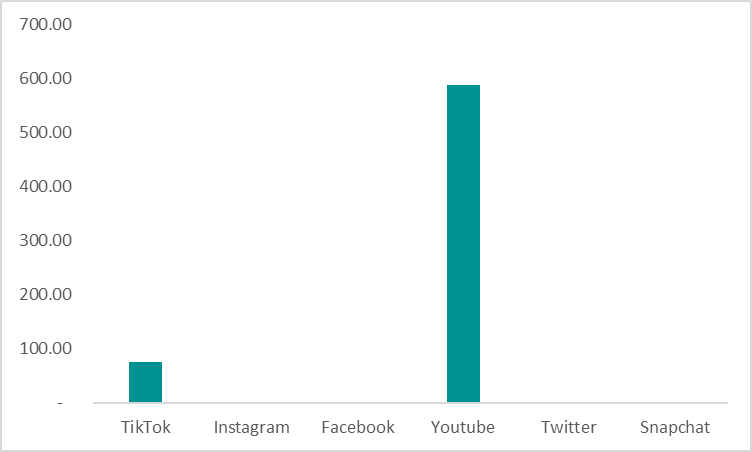
We can already see what is happening here.
YouTube aggressively moderates a lower volume of content.
TikTok is the least “free speech”-platform. This is even more apparent if you look just at SoRs for “illegal or harmful speech”, a category almost exclusively used by TikTok.
Broadly, video platforms moderate more aggressively than others. This implies other platforms like Instagram and X will have a lot of work to do as they increasingly shift toward more video-based content (as they seem hell-bent on doing to chase TikTok).
2. Pinterest is making other platforms look bad
Instagram, YouTube, Snapchat, and X are all surprisingly low on the list for overall SoRs. Pinterest is surprisingly high.
Looking back at the first chart above (total SoRs): Pinterest is fourth on the list with far more SoRs than platforms like Instagram, Snapchat, and X. While data is more difficult to come by for Pinterest in terms of content volume (the adjustment we made above), it is unlikely to massively skew things away from this conclusion. Pinterest is moderating more aggressively than companies like Meta.
Maybe that’s because they want to maintain a nicer environment since Pinterest is about inspiration and visuals? But no, under the hood, removals are driven by issues like pornography, alongside self-harm and violence.
SoRs for several sensitive topic areas:
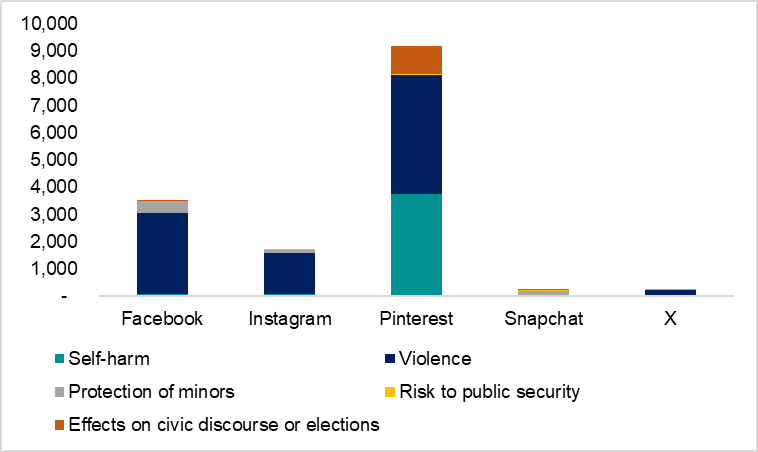
Pinterest leads SoRs for violence. It dominates for self-harm. It is basically the only platform reporting for effects on civic discourse or elections (likely a classification issue - but still).
Interestingly, Facebook’s response is generally more aggressive. About 50/50 for visibility reduction and account suspension, implying that at least half of the bad stuff is from bad accounts that they then remove rather than just reducing the visibility of the post (which is how much of the SoRs are dealt with by other platforms).
Overall, the conclusion that Pinterest is doing more work to moderate its platform is hard to escape. On its own, this is just an interesting note. Now, being able to compare across platforms makes some of these platforms look bad by comparison. This is even more true when you see how manual their process is - they are not just automatically removing things, as we see in the next point.
3. Different moderation approaches should worry the platforms
Even more worrying for platforms is that we can now compare not just the outcomes but the approaches. There are two types of decision metrics platforms have to report: 1) Detection, whether the problem was detected automatically or not, and 2) Decision, whether they made the decision to remove or restrict automatically, partially automatically, or manually.
Most platforms are heavily weighted towards one type of process (i.e., most have almost all of their SoRs dominated by one way of doing detection and decisions). Piecing this together into a 2x2 gives a nice view of the archetypes.
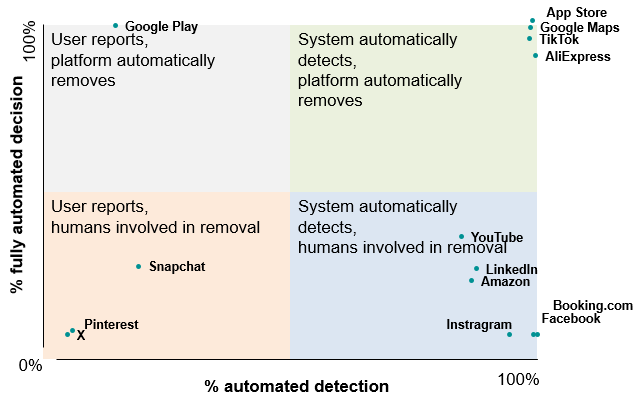
Beyond the archetypes, three things jump out as interesting here:
Most of the significant social platforms at the highest risk of controversial content issues heavily leverage automatic detection but have major processes for non-automatic removal decisions. This implies robust detection algorithms and big human review teams, which makes sense.
TikTok stands out as taking a mostly automated approach out of the social media platforms. All the comparable platforms have at least only partially automated decision-making.
Snapchat, Pinterest, and X don’t have very much automated detection. This implies they rely a lot on user reporting of bad content, which might explain why there are so few SoRs comparatively for X and Snapchat. And it makes Pinterest’s huge SoR numbers even more impressive.
What can we learn?
There are a ton of other interesting insights in the data, especially when you start breaking down by removal reasons, what platforms take down voluntarily vs due to legal violations, or at non-social media issues (like e-commerce or app stores).
For the purposes of tech and tech policy, I see three immediate lessons from this initial look:
The rules, and the tech, need some work: There is inconsistency across platforms in how they’re using the categories. With 73% of all SoRs as “scope of platform service” reasons, covering a very wide range of actions, it is hard to glean differences. Beyond this, the dashboard itself (a PowerBI visualization) needs some work. Real insight only comes from playing with the numbers yourself.
Some platforms should be worried: Now the data is flowing in, it’s becoming easy to see who is doing a lot of moderation and who is doing a little. The relative lack of action at X (in absolute SoR terms) is unsurprising but should worry them. When combined with the complete reliance on user detection it starts to imply platforms might need to invest in new processes as a result of this type of transparency. That takes me to the final point…
Platforms should start comparing their work: There is so much more transparency, and scrutiny will start to come as people uncover the different ways each platform approaches moderation. This turns scrutiny from a pure content and process perspective (i.e., are people noticing you have bad content prevalent on the platform and want you to “do more”) to a competitive question (i.e., why on earth are you, Instagram, finding fewer self-harm or civic discourse violations on your platform than Pinterest?!).
HMM, INTERESTING
Top 5 - The eye-catching reads
The end of the social network: A good article in The Economist on how social networks are becoming less social. We’ve commented before on how TikTok might well be more comparable to Netflix than Facebook, so it’s nice to see this discussed in-depth.
How the BBC develops its recommender algorithms: An absolutely brilliant piece from Knight Columbia explaining how recommender systems work and are developed and the lessons this has for the public.
Access Now 2024 elections internet shutdowns watch: Access Now’s fantastic monitoring has never been more important in this year of elections.
Date set for Google Ads antitrust case: The DOJ will take this to trial in September 2024. 🍿
Microsoft makes a deal with Semafor: More dealmaking between AI companies and publishers, as predicted by me and others. This time it’s in the form of content creation rather than just pure training data. It’s an interesting one.
AND, FINALLY
My top charts of the week
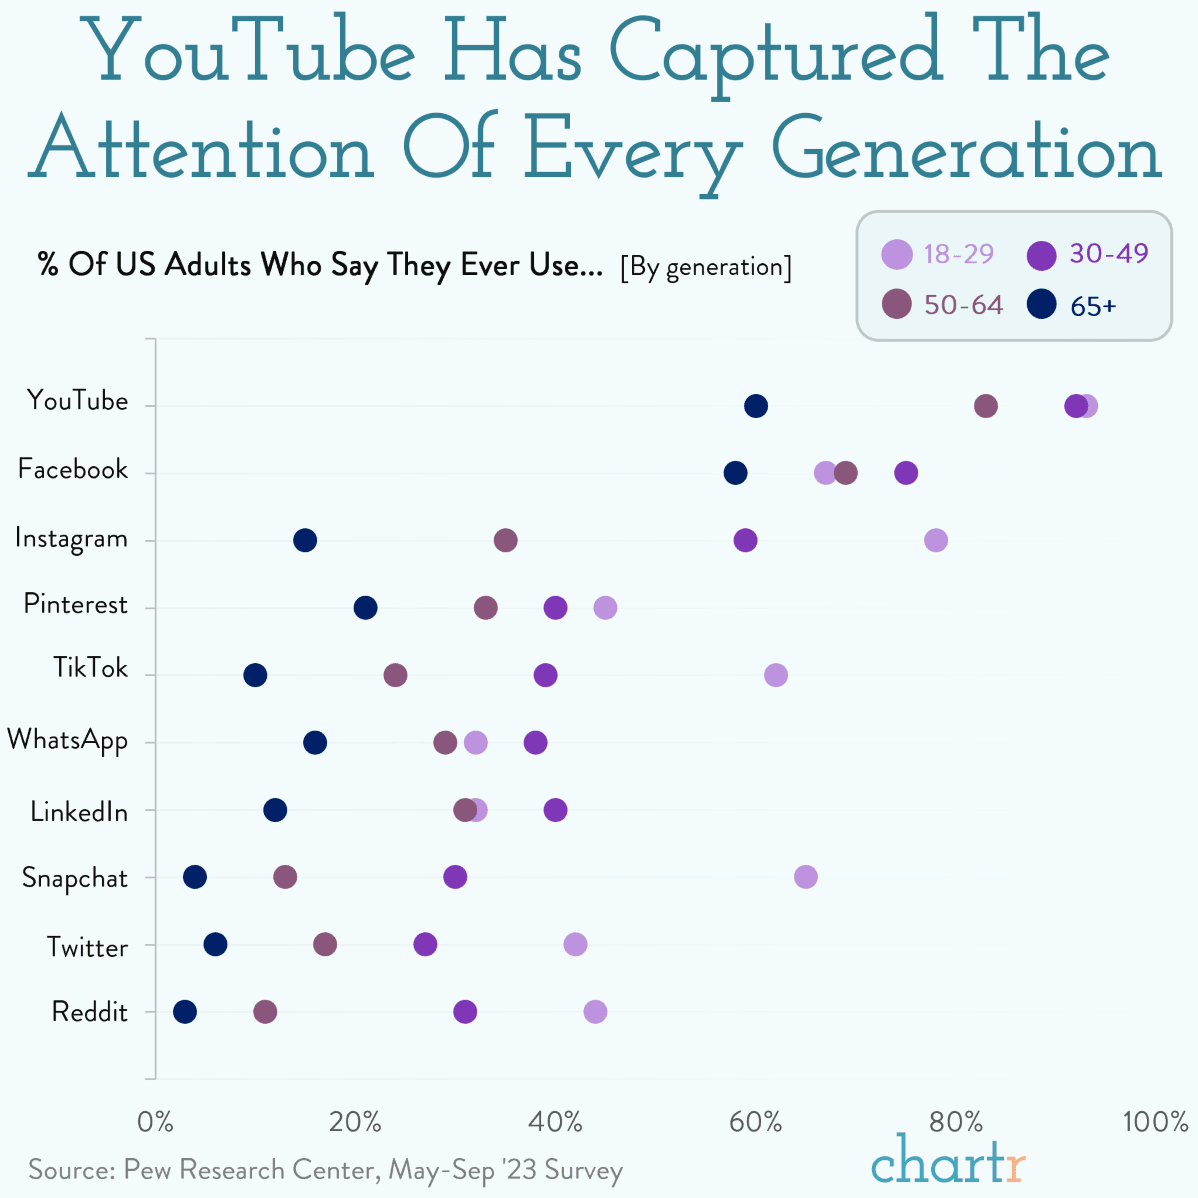
YouTube dominates attention
BTW - when will Reddit be designated by the DSA?!
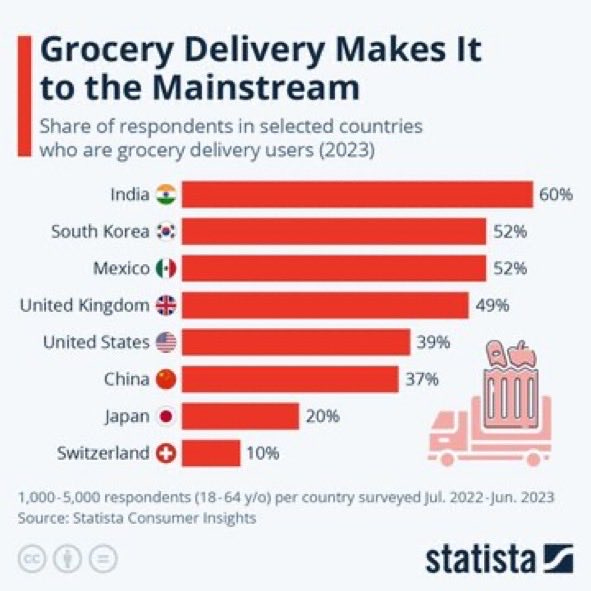
Grocery delivery is here to stay
Notably, these percentages are far, far higher than e-commerce versus brick and mortar retail overall!
Global alliances reordering
Lovely visualization of public allegiances in the emerging world order
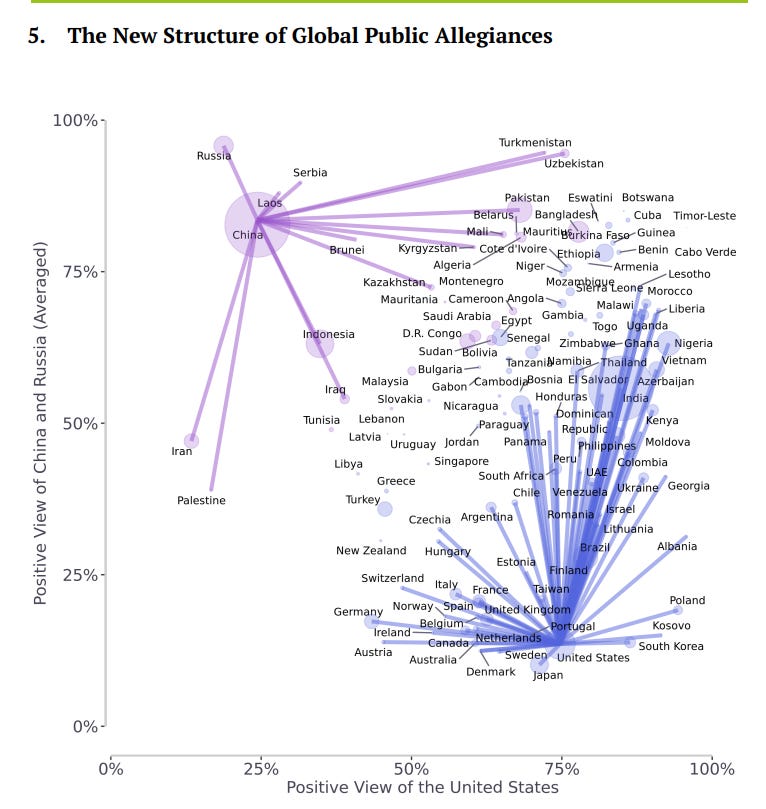
Source: Bennett Institute
Meme of the week